Products
One system. Three ways to access it.
Everything runs on one core: data from any source, standardised once, and calculations performed on one ledger. Every result is reproducible.
Use it as an application, embed it in your own product, or commission a packaged analysis.
RAIIS computes on portfolios, not people. No client personal data is held.
Overview
Offering and commercial terms
Application
RAIIS Platform
A quant desk you can plug in: performance, risk, attribution, rebalancing and reporting across portfolios, mandates and custodians.
02Embedded
RAIIS API
The whole quant system behind your own interface.
03Expert services
Packaged services
Focused, ready-to-run analyses on the RAIIS engine, delivered as standalone engagements: rebalancing analysis, strategy backtesting, performance attribution and asset allocation reviews.
RAIIS does not charge fees on assets under management. Prices exclude VAT.

01 · Application
RAIIS Platform
A quant desk you can plug in. For everyone who works with capital directly: fund managers, asset and wealth managers, family offices and investment controllers.
- Hosting
- Switzerland, on Microsoft Azure
- Coverage
- 50,000+ instruments, 12 bank feeds
- Pricing
- From CHF 7’900 per year
RAIIS Platform has its own site with the full product presentation and the client login. This section is a summary.
01
Versioned and reproducible
Every calculation is stored with its inputs and version, and can be reproduced at any time.
02
Plugged in, not migrated
Works alongside the portfolio management system and custodians already in place. Nothing is replaced.
03
No client personal data
Works on holdings, weights and mandates only. Client identities stay in the systems that already hold them.
Functionality
From raw data to a finished report.
Data preparation
Connect, map, review and consolidate.
Connect
- Bank connectivity. Positions, balances and transactions from your banks.
- File imports. Portfolio data from Excel and CSV files.
- Additional sources. Further bank interfaces and file formats are integrated on request.
Map and validate
- Instrument identification. Imported holdings are matched to instrument records.
- Classification. Investments organised by asset class and other hierarchies.
- Data validation. Checks for missing information, inconsistent values and unresolved matches.
Review
- Exception handling. Investigate and resolve records that need review.
- Corrections. Correct imported data and reverse corrections.
- Source history. Inspect uploaded files, original values and recorded changes.
Portfolios
- Consolidation. Combine accounts and portfolios into groups, in the currency you choose.
- Valuation. Statement values, or holdings revalued at current prices.
- Portfolio history. Dated holdings and the changes between statements.
Portfolio calculations
Performance, risk, attribution and exposures.
Performance and benchmarks
- Performance measurement. Cumulative, annualised and rolling returns over any period.
- Cash-flow treatment. Deposits and withdrawals are accounted for in the return.
- Benchmark comparison. Absolute, relative and excess performance.
Risk
- Risk measurement. Volatility, drawdowns, tail risk, Sharpe and further ratios.
- Risk decomposition. The holdings, portfolios and categories that contribute to risk.
- Risk through time. Rolling calculations with configurable settings.
- Diversification. Correlations and dependencies between investments and portfolios.
Performance attribution
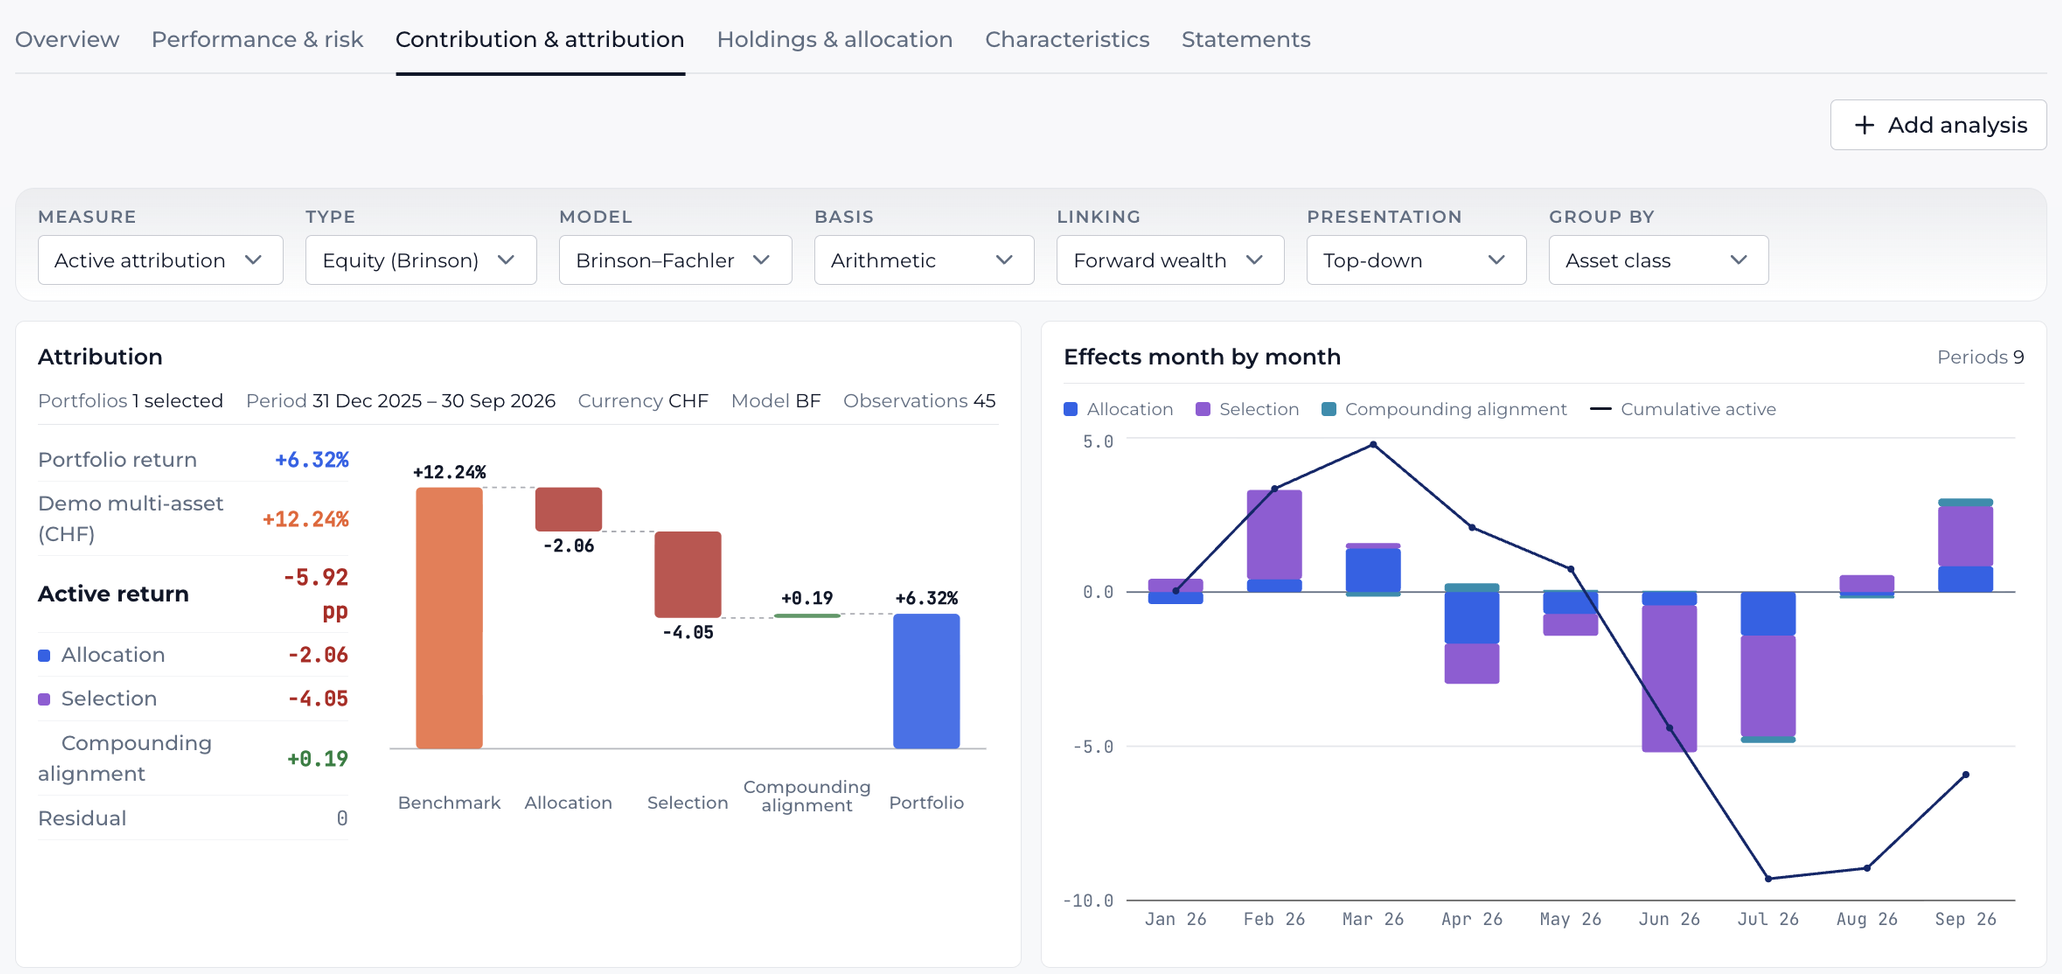
- Return decomposition. Allocation, selection and interaction effects against a benchmark.
- Method selection. Attribution models, arithmetic or geometric, with Carino, Menchero, Frongello and GRAP linking.
- Multi-period reconciliation. Period effects reconcile with the full-period result.
- Specialist attribution. Currency effects and fixed-income return drivers.
Exposures and sensitivities
- Exposure breakdowns. Asset classes, currencies, sectors, countries and liquidity.
- Factor modelling. Factor exposures and their contribution to return and risk.
- Instrument sensitivities. How bonds and derivatives respond to their risk drivers.
- Fund look-through. Underlying fund investments alongside direct positions.
Investment tools
Research, monitoring and portfolio construction.
Research and screening
- Instrument research. Price histories, financial statements and fundamental ratios.
- Screening. Financial, market and classification criteria across 35,000+ equities.
- Saved selections. Save screens and create watchlists from their results.
Watchlists and alerts
- Watchlists. Selected investments organised for ongoing monitoring.
- Alert rules. Conditions on prices and fundamentals.
- Alert review. The investments that meet the configured conditions.
Model portfolios and optimisation
- Model portfolios. Investment universes with explicit or calculated target allocations.
- Portfolio optimisation. Risk-based, downside-risk, benchmark-relative and hierarchical objectives.
- Investment constraints. Position and group limits, cash, turnover and benchmark-relative limits.
- Allocation implementation. Target weights translated into amounts and quantities.
Engine
Strategies, allocation policy and rebalancing, carried through time.
Portfolio strategies
- Portfolio reconstruction. Portfolio histories from recorded transactions or allocation histories.
- Strategy calculation. Alternative portfolio paths, passive or driven by investment signals.
- Portfolio accounting. Holdings and cash carried through time, with trades, fees and external cash flows.
SAA and rebalancing
- Investment policy. Dated allocation targets, permitted ranges and intervention thresholds.
- Allocation monitoring. Holdings compared with targets; drift and breaches identified.
- Rebalancing rules. Scheduled or threshold-triggered, with trade eligibility and execution assumptions.
- Trade calculation and verification. Proposed trades under restrictions, with compliance outcomes recorded.
Report
- Results comparison. Strategy results and benchmarks in one report.
- Detailed records. Portfolio histories, transaction ledgers and rebalancing records.
- Report delivery. Excel workbooks and HTML reports.
Platform
Infrastructure, access and support.
Infrastructure and access
- Hosting. Microsoft Azure infrastructure in Switzerland.
- Data separation. Portfolio data is separated by firm; client data is tokenised.
- Access control. Two-factor authentication and user roles.
Workspace and support
- Custom views. Tables and charts built from portfolio and instrument data.
- In-platform support. Questions and feedback sent from the workspace, with screenshots or recordings.
- Follow-up. Our team works with you through to resolution.
02 · Embedded
RAIIS API
The whole quant system, behind your own interface. Build it into your product and keep the client relationship.
What you get
Access to the entire computational workflow, from standardised portfolio data to finished reports: portfolio accounting, strategy and rebalancing simulations, performance measurement, risk analysis, attribution and reporting.
Who it is for
Portfolio management system providers, banks, pension platforms, wealth management technology providers and reporting platforms. For organisations that want reproducible portfolio calculations embedded in their own products.
How it is delivered
Partners access the RAIIS quant system through an API. Each integration is scoped jointly with our engineers and delivered as a separate implementation project, starting at CHF 14’900.
Ongoing access is provided under an annual partner licence.
RAIIS MCP
Coming soonThe RAIIS quant system, accessible to AI-powered investment tools and assistants through the Model Context Protocol (MCP).
Register interest03 · Expert services
Packaged services
Focused quantitative analyses, delivered as standalone engagements at a fixed fee. For pension funds, institutional asset managers, insurers and other institutional investors.
Typical analyses
- Rebalancing analysisRebalancing rules simulated against your investment policy, incorporating transaction costs and trading restrictions.
- Strategy backtestingPortfolio histories reconstructed and alternative strategies compared under the same accounting.
- Performance attributionBrinson-style attribution with multi-period linking, reconciled to your reported figures.
- Allocation and compliance reviewHoldings monitored against targets, ranges and intervention thresholds, with every deviation recorded.
Each analysis is priced at a fixed fee agreed in advance, starting from CHF 17’900. Results are delivered with the underlying records.
How we engage
Adapt. Deliver. Integrate.
Most engagements begin with a single defined piece of work. The same three steps apply whether the starting point is a packaged analysis, RAIIS Platform or an API integration.
01 · Adapt
We scope to your setup: systems, data and operational priorities.
02 · Deliver
We reproduce your reported figures first, then deliver the analysis: strategy testing, rebalancing, attribution or reporting.
03 · Integrate
Once the value is established, the workflow is integrated across all RAIIS solutions, with ongoing, automated access to the system.
Contact
Get in touch
Tell us about your setup and what you need. We’ll identify the right approach and provide a proposal.